Below is the code I used to create the diagram.
\documentclass[a4,12pt]{article}
\usepackage{tkz-base}
\usepackage{tkz-fct}
\usepackage{tikz}
\usepackage{pgfplots}
\begin{document}
\noindent
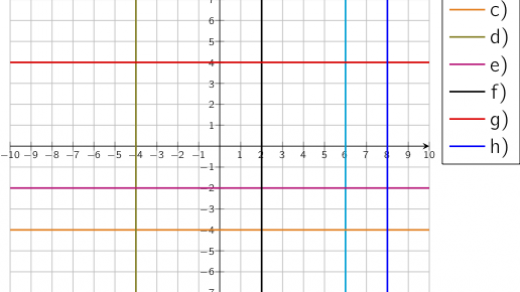
For each of the following lines, \\
find the equation that describes it.\\
\begin{tikzpicture}
\begin{axis}[
legend pos=outer north east,
axis lines = middle,
axis equal image,
xmin=-10, xmax=10,
ymin=-10, ymax=10,
yticklabel style={font=\tiny},
xticklabel style={font=\tiny},
ymajorgrids=true,
xtick={-10,-9,-8,-7,-6,-5,-4,-3,-2,-1,0,1,2,3,4,5,6,7,8,9,10},
ytick={-10,-9,-8,-7,-6,-5,-4,-3,-2,-1,0,1,2,3,4,5,6,7,8,9,10},
xmajorgrids=true
]
\addplot[domain=-4:4,color=red]{3*x+1};
\addlegendentry{line a)}
\addplot[domain=-10:10,color=blue]{2*x-4};
\addlegendentry{line b)}
\addplot[domain=-10:10,color=orange]{-2*x+4};
\addlegendentry{line c)}
\addplot[domain=-10:10,color=purple]{3};
\addlegendentry{line d)}
\addplot[domain=-10:10,color=olive](4,x);
\addlegendentry{line e)}
\addplot[domain=-10:10,color=magenta,label=a]{-x};
\addlegendentry{line f)}
\addplot[domain=-10:10,color=red,dashed]{-2*x-6};
\addlegendentry{line g)};
\addplot[domain=-10:10,color=blue,dashed](-4,x);
\addlegendentry{line h)};
\end{axis}
\end{tikzpicture}
\end{document}
\usepackage{tkz-base}
\usepackage{tkz-fct}
\usepackage{tikz}
\usepackage{pgfplots}
\begin{document}
\noindent
For each of the following lines, \\
find the equation that describes it.\\
\begin{tikzpicture}
\begin{axis}[
legend pos=outer north east,
axis lines = middle,
axis equal image,
xmin=-10, xmax=10,
ymin=-10, ymax=10,
yticklabel style={font=\tiny},
xticklabel style={font=\tiny},
ymajorgrids=true,
xtick={-10,-9,-8,-7,-6,-5,-4,-3,-2,-1,0,1,2,3,4,5,6,7,8,9,10},
ytick={-10,-9,-8,-7,-6,-5,-4,-3,-2,-1,0,1,2,3,4,5,6,7,8,9,10},
xmajorgrids=true
]
\addplot[domain=-4:4,color=red]{3*x+1};
\addlegendentry{line a)}
\addplot[domain=-10:10,color=blue]{2*x-4};
\addlegendentry{line b)}
\addplot[domain=-10:10,color=orange]{-2*x+4};
\addlegendentry{line c)}
\addplot[domain=-10:10,color=purple]{3};
\addlegendentry{line d)}
\addplot[domain=-10:10,color=olive](4,x);
\addlegendentry{line e)}
\addplot[domain=-10:10,color=magenta,label=a]{-x};
\addlegendentry{line f)}
\addplot[domain=-10:10,color=red,dashed]{-2*x-6};
\addlegendentry{line g)};
\addplot[domain=-10:10,color=blue,dashed](-4,x);
\addlegendentry{line h)};
\end{axis}
\end{tikzpicture}
\end{document}